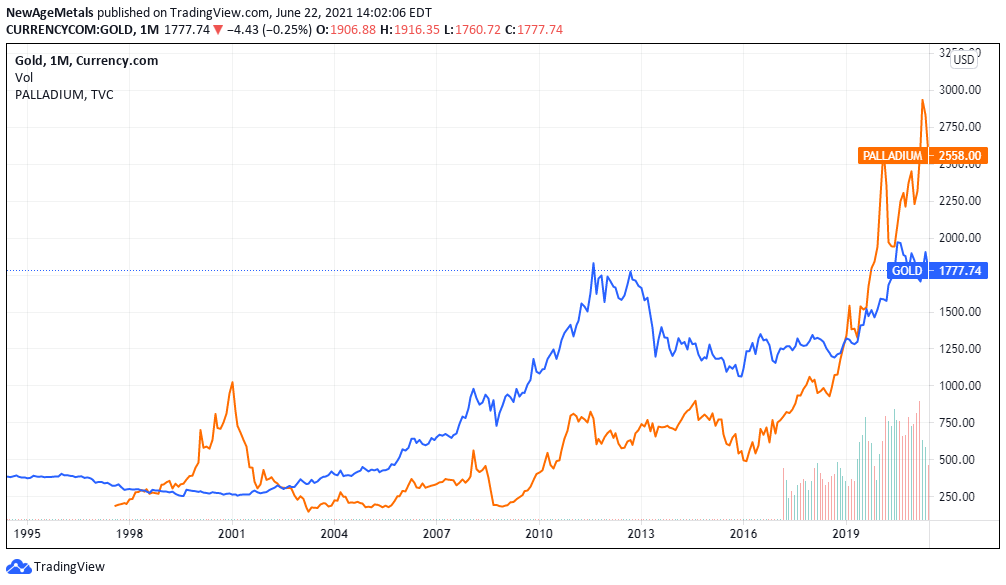
It has been a great year for palladium prices thus far after the Platinum Group Metal (PGM) set new highs on May 4th topping at US$2,985/oz. At time of writing, palladium is priced about $1,000 more than gold per ounce and it was only a few years ago, December 10th 2018, when palladium overtook Gold in terms of value. The sudden change in Palladium value perception is changing people’s outlook on the precious metal. This article will explain the various factors behind the value of palladium and will examine some price predictions by reviewing technical analysis. This blog is not financial advice and is merely a collection of available online material on the subject.
Palladium is an important metal in the automotive industry. Its use application is found in the catalytic converter, which turns harmful emissions into less toxic pollutants. Stringent emission controls have increased demand for palladium over the years. Roughly 80% of palladium is used by the automotive industry and around 18% is used for jewelry. The shiny metal is considered a precious metal and even has an ISO currency code which means some banks can accept Palladium bullion as a currency deposit. Only gold, silver and platinum are the other metals to have such code. Other, less relevant, use applications of palladium include surgical instruments, electrical components, spark plugs and more.
Gold on the other hand has less industrial use but has been the store of value for thousands of years. While it has some applications in electronics, gold is mainly used for jewelry and finances. Up until the 1930s, Britain and the US would use the gold standard, meaning their currencies were based on the value of gold. This is no longer the case. Although gold is considered amongst many people to be a safe investment, it is no longer used to back currencies.
The question many are asking is how has palladium become more expensive than the all-mighty gold? It comes down to the fundamental forces of demand and supply. Palladium has been in a supply deficit for years while tighter global emission controls are increasing demand. The metal has seen both supply side and demand side pressure, causing the rally behind the price.
In 2020, Russia had the largest market supply of palladium with 91,000 Kgs, while South Africa had 70,000 Kgs and Canada with 20,000 Kgs. Russia and South Africa are the biggest players in the PGM sector. Some investors worry that these 2 countries lack the stability to create a constant supply of PGMs. For example, Nornickel who is the largest global producer of Palladium, suffered from a flood at their Oktyabrsky and Taimyrsky mines in Siberia on February 24 after it detected subterranean water flowing into the facilities. Operations were forced to stop until the issue was solved. Meanwhile in South Africa, the Covid outbreaks are forcing the government to implement lockdowns which are slowing down mining operations. PGM prices are likely to see an increase due to another lockdown in South Africa. The weekly report by Heraeus Precious Metals illustrates two graphs, one showing Covid cases and the other showing daily refined platinum production. A correlation can be spotted which shows lower platinum output as cases rise. Furthermore, South Africa has been known to have issues with electricity. Mining companies are being affected by frequent power cuts caused by state power utility Eskom. Breakdowns at several of the country’s ageing coal-fired power stations are slowing down mining operations are creating inefficiencies which ultimately affects the total output of PGMs. Also, It is no secret that Russia has a complicated relationship with the West. With palladium becoming one of the most important metals, in terms of price and industrial use, it certainly gives Russia a powerful economic tool which it may use to influence world markets. North America can correct this global supply imbalance by bringing more focus on palladium deposits in Canada and US.
The palladium price outlook is looking positive for the near and mid-term. The price of palladium has soared 398.25% since 2016, making it one of the best-performing of all commodities. This price increase is greater than that for gold, silver and platinum over the same period. By comparison, gold prices only logged a little over 200% during the same time frame. Examining global supply and demand for palladium will illustrate that there is clearly a supply deficit for the metal. The following table contains an overview of supply and demand for palladium from 2012 onwards. The data are given in koz.
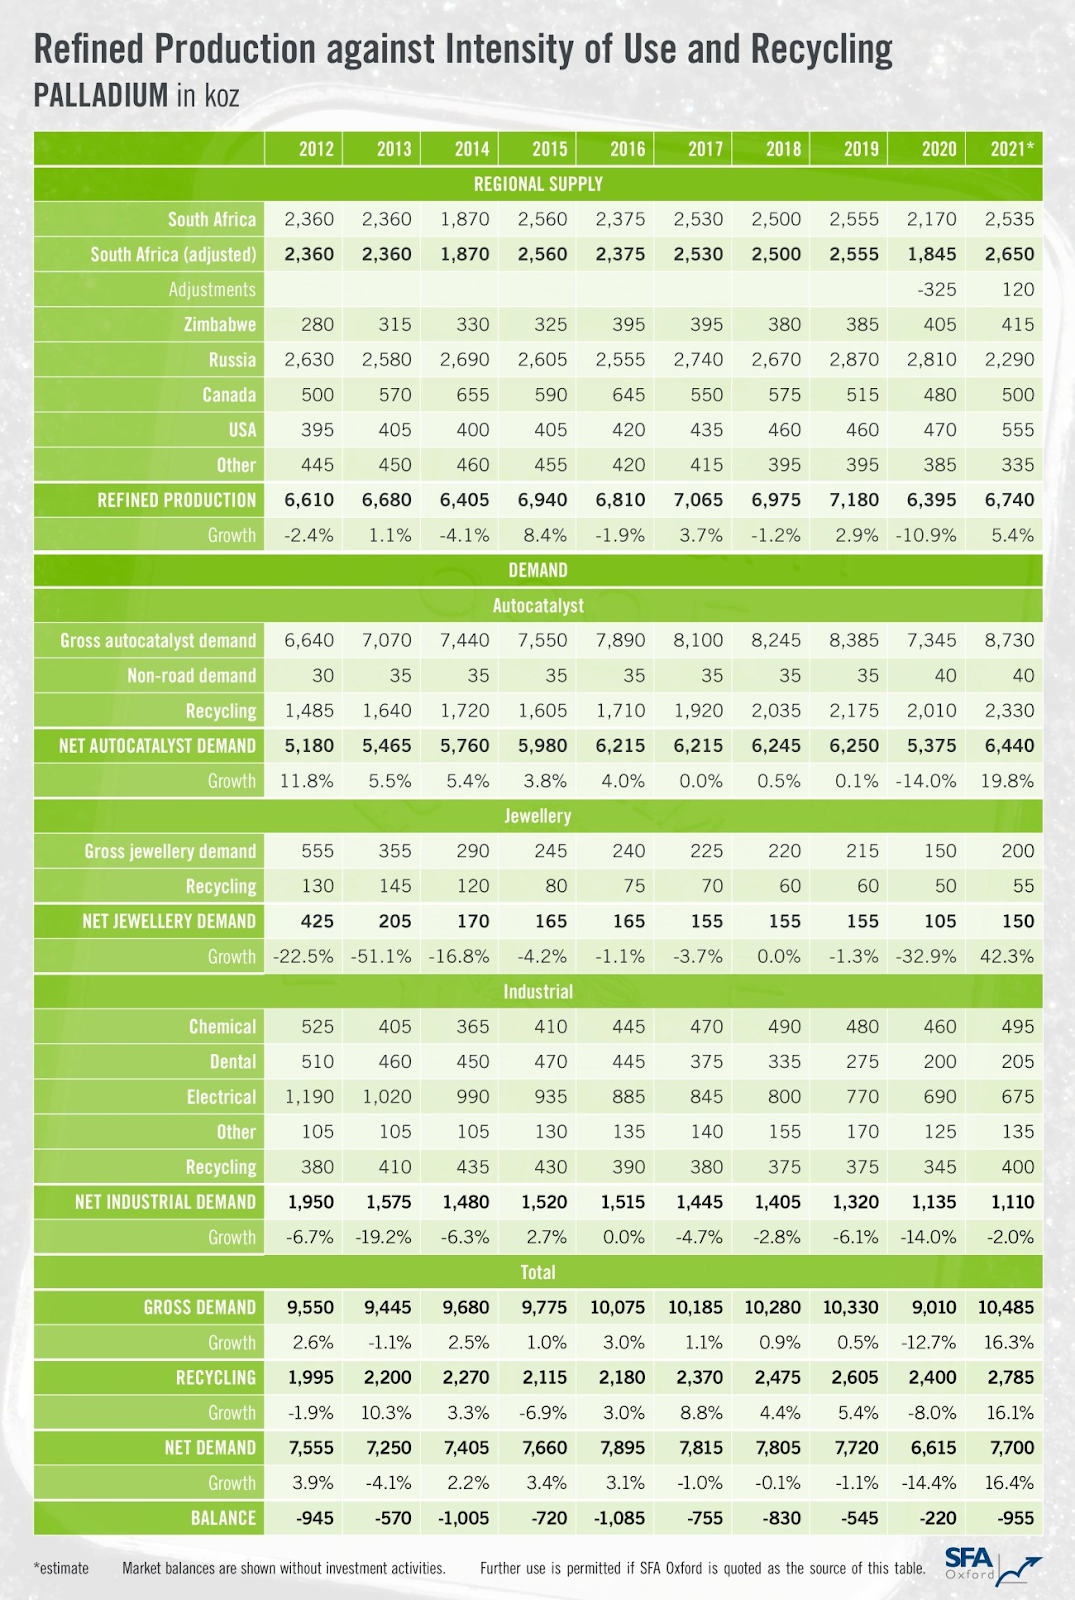
We can deduce from the data table that demand for palladium is increasing at a higher rate than supply. Supply of palladium increased by 5.4% in 2021 while demand in the auto catalyst sector, the biggest consumer of palladium, increased by 19.8%. The jewelry sector saw a 42.3% increase in demand for the precious metal. On the other hand, gold demand for the quarter was at 815.7 metric tons, down 23% compared with the first quarter of 2020.
What are some differences between gold mining and palladium mining? Gold is a much bigger market than palladium with a market cap of close to $12 trillion while Palladium is just under $5 billion. Much more gold is mined a year compared to Palladium, in fact there is only a small number of mines in the world that primarily mine Palladium with Russia and South Africa hosting the majority of them.
Palladium is a metal in high demand due to increased global regulations surrounding emissions of harmful gases. Research suggests that fuel cell EVs, that run on hydrogen, will occupy a greater market share in the future. These types of vehicles require more PGMs than current generation vehicles therefore it is reasonable to assume that PGMs will continue to hold demand. New Age Metals investors have significant exposure to palladium through the company’s flagship River Valley Project. River Valley hosts a NI 43-101 compliant mineral resource of approximately 2.9 Moz Palladium equivalent (PdEq) in the Measured + Indicated classification and another 1.1 Moz PdEq in the Inferred classification. The Project’s palladium metal content alone is approximately 1.6 Moz Measured +Indicated and 0.5 Moz Inferred. A multi-million ounce district scale asset containing these strategic metals in proximity to major mining and processing infrastructure presents a unique opportunity for investors and other stakeholders.